“Language statistics” is an important concept to understand. “Language” here refers to language in any modality–spoken, written, signed. “Statistics” refers to patterns that language exhibits. Think of the statistics as simply counting how often elements of language are used.
These statistical patterns are important because humans are statistical learners. One of the principal ways we learn is by picking up on patterns in the environment. This type of learning occurs automatically, without conscious attention, every time we use language. Most of what we learn about print and speech is acquired via this mechanism, which is called “statistical” or “implicit” learning. It does not require explicit instruction. However, it can be greatly boosted by instruction. It can also be boosted by structuring children’s experiences in ways that take advantage of the statistical properties of language.
So: language exhibits statistical structure; that’s a good thing because people are statistical learners; the purpose of reading instruction is to enable this type of learning.
“Language statistics” may sound like a fearsome concept, but it’s just counting. (Of course, there are a lot of things we can count, and it takes computers to do the counting.) More important, language statistics are the teacher’s friend–and the learner’s as well. They are the key to efficient instruction and successful learning.
What are language statistics?
Languages consist of elements such as words, morphemes, syllables, and phonemes.
At each level, the elements combine in ways that produce patterns. Using “big data” methods we can quantify–count–how often different patterns occur. Those quantities are “language statistics”. They concern frequency: how often different units and combinations of units occur.
These patterns also show up in the ways words are spelled, of course, because writing is a code for representing spoken language. The two codes are highly correlated but not perfectly.
Let’s look at some examples of these statistics and consider how they are relevant to learning and instruction.
Word frequency
You’re probably aware of one very basic language statistic, word frequency. Words vary in how often they are used. For example, HAVE, SAID and MOST are used much more often than POSSESS, ORATED, and NEARLY. We don’t know exactly how often each word is used by each person, but we can estimate this by counting how often words occur in large samples of text and speech.
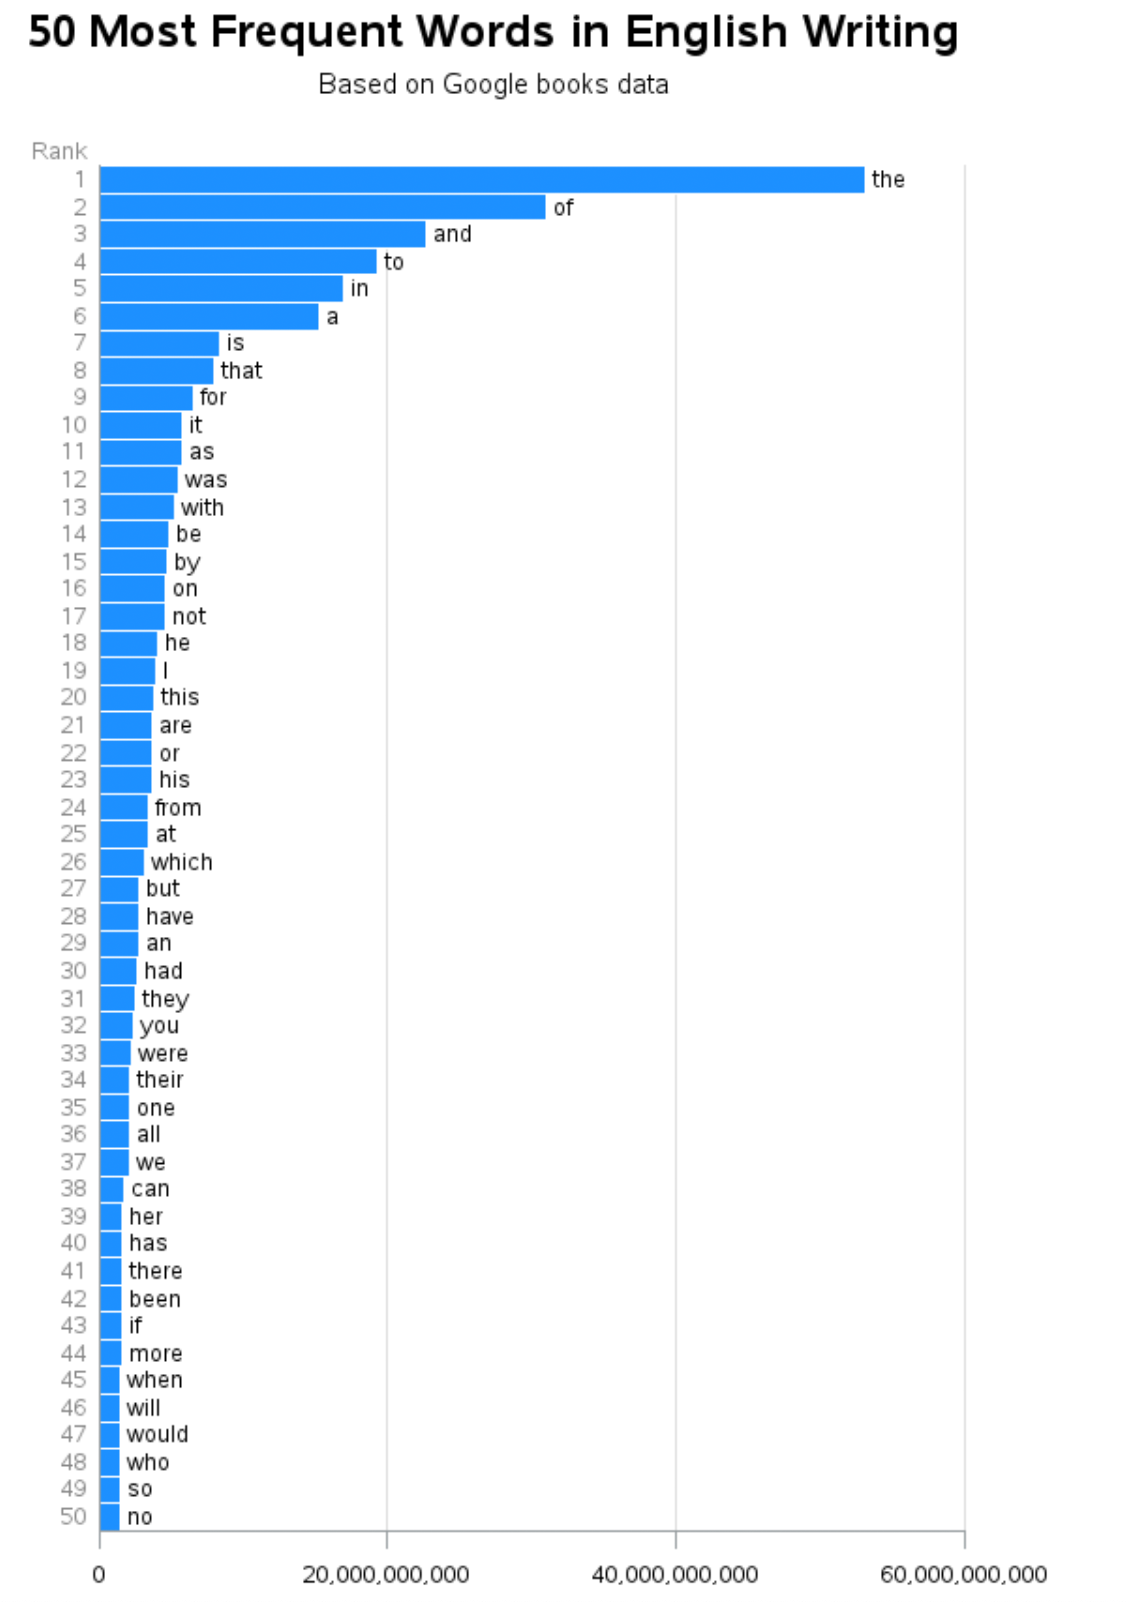
The figure above (taken from here) shows the 50 words that occur most often in the enormous Google Books corpus (a corpus is a sample of words; this one has hundreds of millions of words). A small number of words are used very often: THE, A, TO, AND and so on. Then there is a much larger number of words that are used less often. This is a universal property of words in languages. The figure only shows the top 50 words, but already the frequencies are dropping off rapidly. The many thousands of other words we know create a “long tail” distribution: many many words with low frequencies.
What this means: A relatively small number of the words account for a very high percentage of the words we use in speaking or reading. The 250 highest frequency words account for about half of all words we use. That’s amazing, given that we know thousands of words!
Let’s make this concrete. Say that we record all of words you hear in a year. Say the total turns out to be a million (Only a guess. Actual number depends how much listening you do. But, it’s a big number.) That million words will consist of some smaller number of distinct dictionary words, maybe 4,000. We count how often each of those words was used. We know the total is a million. The 250 or so most frequently used words will account for about half of it. The other 3750 account for the other half million. We get a lot of mileage from the most frequent few hundred words.
These facts are good for teachers and learners. For teachers: you can focus on the relatively small number of words that matter the most. Beginning readers who can read and understand the 250-300 most common words will be able to get pretty far! They will still need to learn “special” words, such as DINOSAUR or SKELETON, which are low frequency words except when they are relevant to a topic we’re reading or talking about. Those can be introduced in a topical context, where there will be other, related words and concepts.
Warning: Word frequency isn’t a fixed number. It’s a number–a statistic–that results from counting how often a word occurs in a sample of language. The exact frequencies vary depending on what language sample is used. The frequencies of words in children’s books differ from those in books for adults. The frequencies of words differ for spoken and written language. THUS and SINCE occur much more often in print than in speech; HEY and GONNA occur more in speech than in print. POLYMER and CENTRIFUGE are common in chemistry textbooks..
Note that the frequencies of words change when we use them. If the topic is Dinosaurs, words such as DINOSAUR, FOSSIL, and EXTINCT are suddenly high frequency words–for now. Any word can be made into a “high frequency” word just by using it! And any word can be made “low frequency” if we avoid using it!
Conclusion: The facts about word frequencies are helpful for teachers and learners. A reader or language learner gets off to a really great start if they only know a few hundred words. The same is true of other units such as phonemes and letters, and how the combine with each other..
Try this: On this website, you can paste in a text and it returns a list of words and their frequencies. It’s pretty cool, especially if you paste in different kinds of texts.
Phoneme frequency
Everyone loves phonemes, so let’s look at them.
The highest frequency phoneme in English is schwa, the short, reduced vowel in many unstressed syllables, as in ABOUT and SECOND. Consonants such as /n/ and /t/ occur more often than /f/ and /sh/.
Again, phoneme frequency is statistic, an estimate. The exact numbers depend on which phonemes you count and in which sample of language. There isn’t a fixed list of phonemes in English. (The number varies from under 40 to over 50 in different theories). The researcher who compiled these data used 39 phonemes, because that is how many were coded in the pronouncing dictionary that he used. The results will differ in minor ways if you use 44 phonemes.
Like words, the frequencies of phonemes also differ–a lot.
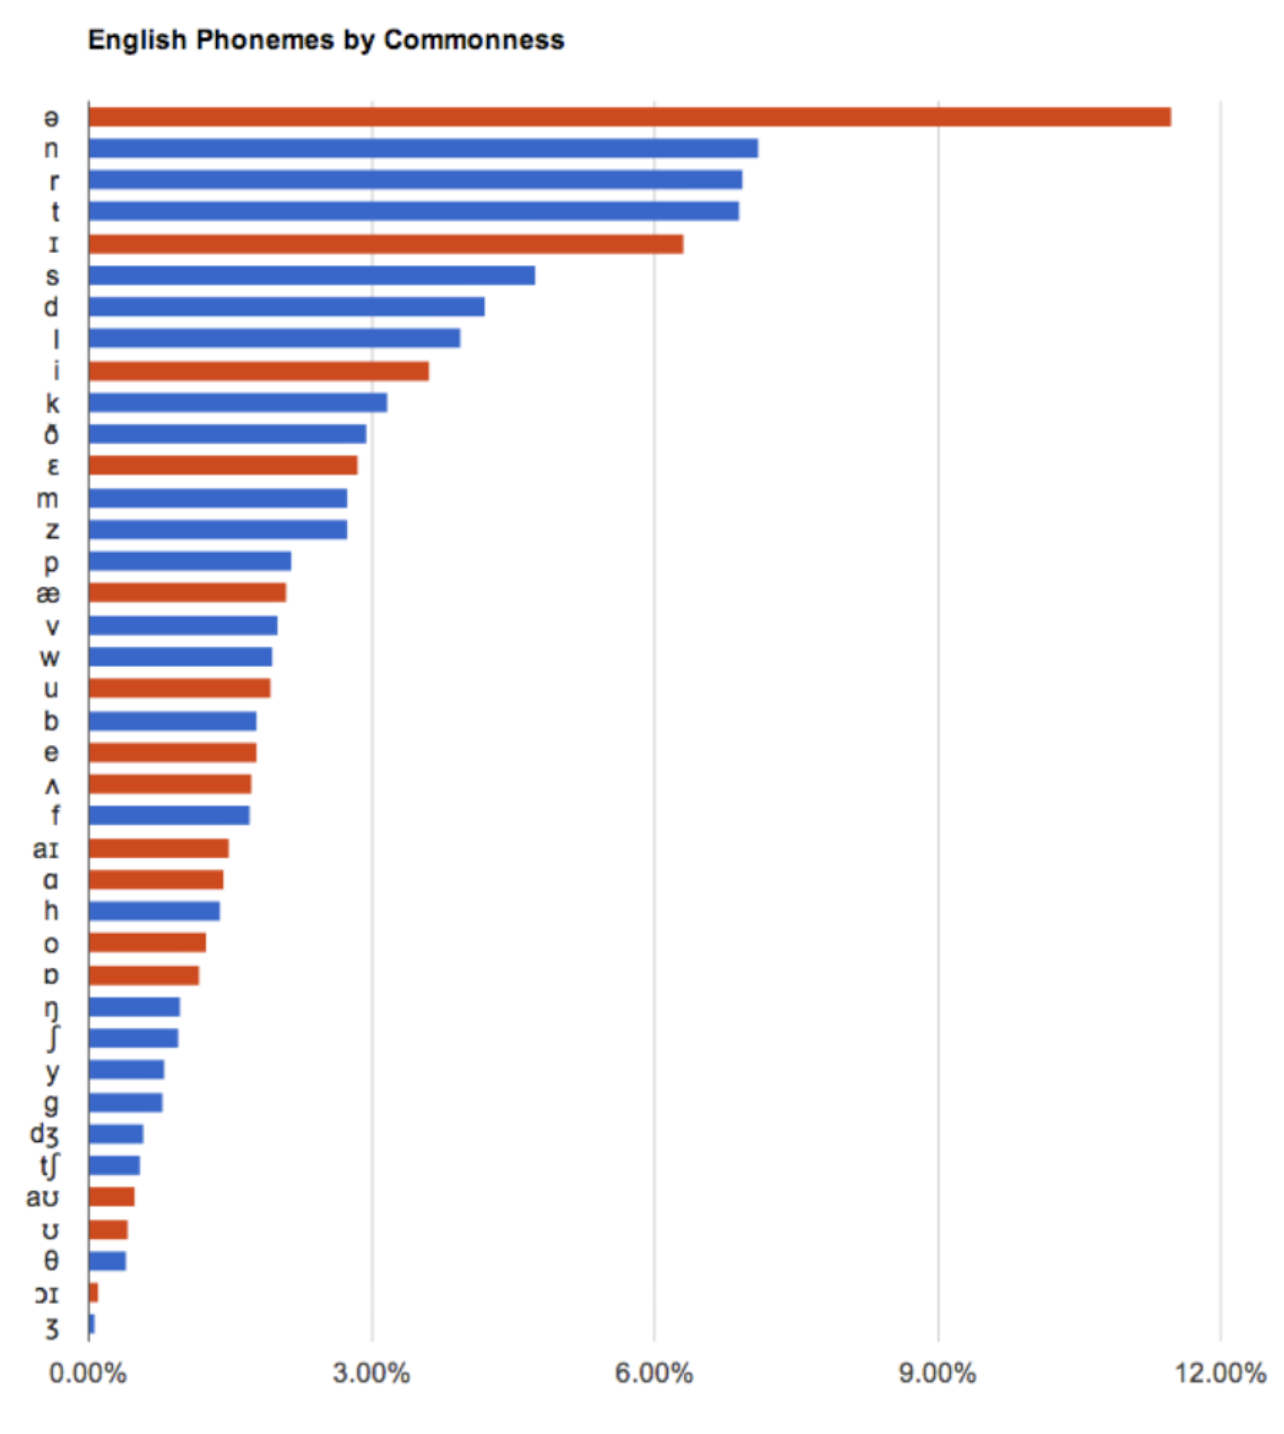
These data were obtained by looking at all of the words in a large corpus of English text (millions of words of text). Each printed word was replaced with its phonemic (dictionary) representation. He then counted how often each of the 39 phonemes occurred. 11.49% of all the phonemes were schwa. 7.11% were /n/, and so on.
Again a small number of elements are used with high frequency and then the frequencies taper off. (These data are not as extremely skewed as for words because there are only 40 or so phonemes, whereas there are thousands of words.)
The 8 most common phonemes account for over half of all the phonemes in words. The phonemes at the bottom are used much less often: the /zh/ as in azure, /j/ in jump, /oy/ in boy, /th/ in there.
Here again language statistics are your friend. There are 39 (or 44 or whatever) phonemes in English, which is a lot of patterns to teach in “phonemic awareness” activities. However, there is no obligation to teach all the patterns. You want to start with the common phonemes, the most familiar ones. The goal is for children to learn enough about phonemes and graphemes to enable moving on to the important stuff, learning about the spellings, pronunciations and meanings of words. Spending precious instruction time on low frequency phonemes like /zh/ is a waste! Worse if you have to spend as much time on them as on the high frequency ones.
Instruction about a small number of common phonemes wil be sufficient for many readers to catch on. Some may require more. Getting off the ground with the common patterns will enable them to figure out the less common ones later. That is what beginning readers have done for generations (if given the opportunity).
The Take-Away
Language is systematic at every level: units combine in specific ways to create other units: syllables, morphemes, words, sentences. Some patterns occur and others do not. Some patterns occur often, others rarely. These are the “statistics of language and print.”
Humans are statistical learners. Babies begin picking up on statistical patterns in spoken language from birth. These patterns are not explicit taught. Rather, they are learned via “statistical” learning. This type of learning is implicit, meaning that it occurs without conscious awareness or intent. It happens as we engage in behaviors like talking, listening, reading, and writing.
People are consciously aware of very few of the statistical patterns in print and in language, only the simplest ones. Our brains pick up on all sorts of patterns, automatically, without having to be told, and use them in producing and comprehending spoken and written language.
Learning to read involves a combination of statistical learning and explicit instruction. Instruction orients the beginning reader to what there is to learn, namely a system with properties such as having strings of letters that represent sounds and words, and sequences of words that form sentences. We can’t be taught everything about print: it’s too complex and we aren’t even aware of most of the patterns! Explicit instruction is also time-consuming, for both teacher and learner.
The goal is to use explicit instruction to set up implicit, statistical learning: being able to learn about these patterns while we are using language.
For more information about word frequency, look here:
Word frequencies in contemporary American English
Word frequencies depend on genre, e.g., movie scripts are different from novels.
Here are some statistics about words and letters from a computer scientist.
Word frequencies in English that you can download. Fun!
Here is one of the sites where researchers get frequency data. Notice that there are data for several samples of English. You get different results depending on what kinds of texts are included.
A short blog entry about frequency. |